BRIDGING THE GAP
Visualizing Columbia's Transportation Security and Its Potential Impact on Engagement
Columbia, Missouri has a community engagement issue.
People feel like their voices aren't heard and that they cannot make a difference. One major component to advocating for oneself and engaging with the community is access to transportation. When someone lacks reliable transportation, cannot drive a car, or feel like the transportation system is not safe for them, they are unlikely to be able to advocate for policies and issues that are important to them. With Local Motion's 2024 Community Survey, individuals' transportation security index can be analyzed and hypothesized about how this may affect respondents' ability to engage with local leaders and their community. These transportation security indexes can also be compared with individual and community demographics (e.g. income, race, housing status) to view a relationship between transportation security and those who are consistently underserved in the community. Because transportation is essential for inclusive and equitable community engagement, if those who face transportation barriers are also those that have been historically underrepresented, then we continue to build and plan cities for those most privileged.
THE COMMUNITY ENGAGEMENT PROBLEM
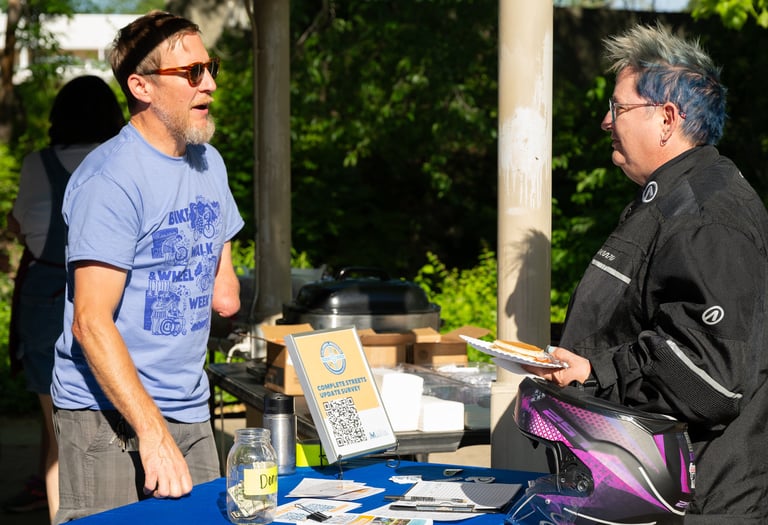
Columbia, Missouri is experiencing a civic engagement emergency where its’ citizens are increasingly feeling like their voices are not being heard and needs are not being met in decision-making processes. Since Columbia’s City Manager, De’Carlon Seewood, was hired in 2022, community engagement has been a pillar of his leadership mission because citizens do not feel like they have the opportunity to authentically engage in local decision making (Dunlap 2022). There are many factors involved in supporting successful civic participation, one important component being access to transportation (Roach & Fritz 2022). A lack of diverse transportation options can also make generating community power and change prohibitive (Adorno et al. 2016). If people cannot access public meetings because of a transportation barrier (i.e. not being able to afford a car or not being able to drive a car), whether City related or community organizing, systemic issues continue to be unchanged, and people’s needs continue to be unmet. Local Motion, a nonprofit organization, advocates for biking, walking, and public transit solutions in Columbia, Missouri. Their 2023 annual transportation community survey results show that out of the respondents who do not own or operate a motor vehicle, 62% say they aren’t able to be civically engaged because of a lack of transportation (Ascani 2023). The City of Columbia has made increased efforts to prioritize engagement through City Councilperson neighborhood meetings, a Community Summit, and City budget public meetings. However, engagement on transportation projects continues to be a struggle for both the Public Works department and the community.
Using Local Motion's 2024 Community Survey results, we can visualize individual's transportation security index in relation to demographic data and plan for the future.
Because people in Columbia, Missouri don’t have access to a robust transportation system (i.e. thriving public transportation system, safe and accessible biking and walking infrastructure), a social determinant of health (Ganguly et al. 2024), this hinders a holistic, community engaged approach to improve overall health equity and disrupt the cycle of poverty. Furthermore, people with transportation barriers can have unique and impactful feedback and engagement regarding transportation issues specifically, that need to be addressed by planning professionals (Lopez 2023). By addressing the systemic challenge of inequitable transportation, academic researchers, policymakers, urban planners, and community organizations can create more civically engaged spaces that then build healthier, more resilient communities, where access to resources reduce health disparities among populations.
What is a transportation security index (TSI)?
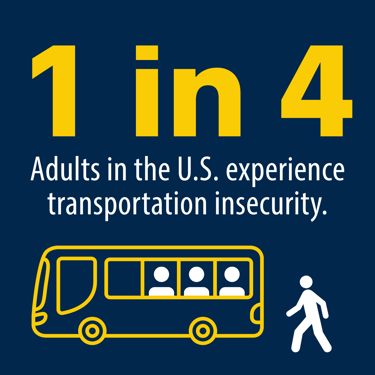
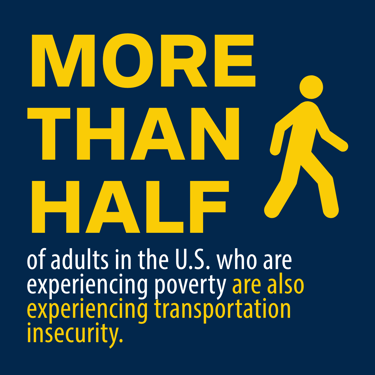
"Modeled after the Food Security Index, the Transportation Security Index is a 16-question survey composed of items that focus on the symptoms of transportation insecurity (for example, taking a long time to plan out everyday trips and rescheduling appointments)." (Gould-Worth et al., 2018)
TAKING A LOOK AT THE DATA
While Local Motion's 2024 annual transportation community survey does not include questions directly related to community engagement, it does include invaluable information about respondents' transportation security, priorities for infrastructure and funding, and demographic data. All of these data can be analyzed and conclusions can be drawn as to how transportation insecure Columbia, Missouri is and how that, in turn, affects community engagement and inclusive decision making.
WHAT CAN WE GAIN FROM THESE MAPS?
Transportation insecurity is not just about the ability to drive or own a vehicle. It is also about the built environment - sidewalks, bike lanes, and the public transportation system access (Ong et al., 2022). These maps visualize individuals, where they live, and their TSI crossed with demographics like race, income, and disability status. While not shown in these maps, a logical next step would be to show what infrastructure exists in the areas with greatest transportation insecurities, and how access can be improved to get to all basic needs and also public meetings and engagement opportunities.
The raw data can also show how disproportionately affected certain populations are with regards to transportation insecurity. For example, about 17% of Columbia’s population is made up of Black, Indigenous, and People of Color (BIPOC). However, about 24% of people who filled out Local Motion’s survey who identified as a member of the BIPOC had some kind of transportation insecurity (<2), showing that BIPOC individuals are disproportionally affected by transportation insecurity.
Additionally, about 9% of Columbia’s population identifies as having a disability. However, about 36% of people who filled out Local Motion’s survey had some kind of transportation insecurity (<2) and identified as having a disability, showing that the disabled population is disproportionally affected by transportation insecurity.
DIFFICULTIES WITH THE DATA, CONCLUSIONS, AND NEXT STEPS
In order to be statistically significant and impactful, researchers need to continue to look at these data for representative data issues, robust data across all indicators (e.g. race, income, mode of transportation). Additionally, the survey format and methods should be reevaluated for future data gathering. Although it is reported that a lack of transportation impacts public participation, Local Motion's 2024 community survey did not include questions about community engagement or access to public participation opportunities. The addition of this question is essential to statistically link transportation access and community engagement in Columbia, Missouri.
Based on all of the information and analyses done in this specific project, although currently statistically insignificant, people who identify as being a part of the BIPOC community and those with disabilities face in Columbia, Missouri disproportionately face transportation insecurity compared to other populations. Because these populations face more transportation insecurity, researchers can make the assumption that, since transportation is a barrier to engagement, that they also face barriers to participation in things like advocacy, voting, and decision making. Therefore, not only are policies and funding not made with everyone's voice in mind, transportation decisions and planning are the victims of the same vicious cycle: because people cannot get to meetings, systems don't work for them, and they continue to be underserved and face barriers to basic needs.
So, what comes next? First, adding more maps and data into these maps to make them actionable whether that be for activists, community leaders, or for City Council. Roping in infrastructure data, specifically, will allow a fully robust report to City Council and Staff about how infrastructure for people who do not use cars as their main mode of transportation affects their barriers to resources and participation. Researchers should explore alternative community geography methods to strengthen the impact of this project for the community and those who hold decision-making power. Things like photovoice, oral histories, and counter mapping allow for collective power-building and rebellion against the structures that hold people in cycles of inequity (Maharawal & McElroy, 2018). Although these data are community based, counter-mapping can be used as an impactful tool to not only create a product by and for the community, but to also create collective power and relationships with people who share a lived experience. Counter-mapping can not only be a tool for engagement, but also a way to take cartographic ownership and challenge structures of oppressions (Inwood & Alderman, 2020).
It is important to note that, while these data and analyses are integral to the transportation story of those who live and travel in Columbia, Missouri, these are not things that those in power (e.g. City Council, City Staff, Urban Planners, Transportation Planners) do not already know. Similar to how Shannon discusses "food deserts" as a way to describe areas that just happen to be built without adequate access to foods rather than intentionally designed through a system of institutional racism, classism, and corporate greed, (Shannon, 2021) transportation is subject to a similar trajectory. Investing in infrastructure, building streets, and funding public transportation were not only used as a method of segregation, racism, and classism in the past (Bert, 2022). To continue to build an inequitable transportation system is a policy choice. To deny people the right to get where they need to go safely and accessibly are policy choices. The accept anything more than zero people being seriously injured or killed just while getting where they need to go is a policy choice. These data are the start of unmasking our history in disinvestment and the fight to reverse it. Community geography has the power to build transformative change and to give those in power no other choice than to build just and equitable systems so that everyone can thrive.
SOURCES
Adorno, Gail, Noelle Fields, Courtney Cronley, Rupal Parekh, and Karen Magruder. “Ageing in a Low-Density Urban City: Transportation Mobility as a Social Equity Issue.” Ageing and Society 38, no. 2 (February 2018): 296–320. https://doi.org/10.1017/S0144686X16000994.
Ascani, Rikki. “2023 Annual Report Connecting Community.” Columbia, Missouri: Local Motion, December 1, 2023. https://old.lomocomo.org/wp-content/uploads/2023/12/2023-Annual-Report_FINAL111423.pdf.
Bert, Hally. Policing Through Planning: Safety and Crime and the Zero-Fare Program. December 2022. Accessed December 9, 2024. https://sourcenm.com/wp-content/uploads/2022/12/Policing-through-Planning-Safety-and-Crime-and-the-Zero-Fare-Program-Hally-Bert-DEC-2022-w_city-reports-added.pdf .
Dunlap, Charles. “New Columbia City Manager De’Carlon Seewood Focused on Engagement with ‘informed, Active’ Residents.” Columbia Daily Tribune. Accessed October 15, 2024. https://www.columbiatribune.com/story/news/local/2022/01/16/decarlon-seewood-ready-start-work-columbia-missouri-mo-city-manager/9169415002/.
Fischer, Heather, Daniel Block, Amber Bosse, Timothy L. Hawthorne, Jin Kyu Jung, Hamil Pearsall, Amanda Rees, and Jerry Shannon. “Doing Community Geography.” GeoJournal 8 (2021). https://doi.org/10.1007/s10708-021-10457-8 .
Ganguly, Anisha P., Kristin S. Alvarez, Sheryl R. Mathew, Virali Soni, Suman Vadlamani, Bijal A. Balasubramanian, and Kavita P. Bhavan. “Intersecting Social Determinants of Health among Patients with Childcare Needs: A Cross-Sectional Analysis of Social Vulnerability.” BMC Public Health 24, no. 1 (3/1/2024 2024): 1–10. https://doi.org/10.1186/s12889-024-18168-8.
Gould-Werth, Alix, Jamie Griffin, and Alexandra K. Murphy. 2018. “Defining a New Measure of Transportation Insecurity: An Exploratory Factor Analysis.” Survey Practice, 11:2, pp. 1-36.
Inwood, Joshua F. J., and Derek H. Alderman. “‘The Care and Feeding of Power Structures’: Reconceptualizing Geospatial Intelligence through the Countermapping Efforts of the Student Nonviolent Coordinating Committee.” Annals of the American Association of Geographers 110, no. 3 (May 2020): 705–23. https://doi.org/10.1080/24694452.2019.1631747 .
Lopez, Ana I. “Community Engagement at the Intersection of Public Health and Transportation,” n.d.
Maharawal, Manissa M., and Erin McElroy. “The Anti-Eviction Mapping Project: Counter Mapping and Oral History toward Bay Area Housing Justice.” Annals of the American Association of Geographers 108, no. 2 (March 2018): 380–89. https://doi.org/10.1080/24694452.2017.1365583 .
Pech, With Chhandara, Justine Pascual, Silvia R González, Jonathan Ong, and Gregory Pierce. “Screening Method and Map for Evaluating Transportation Access Disparities and Other Built Environment-Related Determinants of Health,” n.d.
Roach, Mary, and Jonathan Fritz. “Breaking Barriers and Building Bridges: Increasing Community Engagement in Program Evaluation.” Evaluation and Program Planning, Invigorating Program Evaluation on HIV Prevention and Care Efforts Among Racial/Ethnic, Sexual, and Gender Minority Populations: PrIDE Demonstration Project, 90 (February 1, 2022): 101997. https://doi.org/10.1016/j.evalprogplan.2021.101997.
Shannon, Jerry. “Dollar Stores, Retailer Redlining, and the Metropolitan Geographies of Precarious Consumption.” Annals of the American Association of Geographers 111, no. 4 (July 2021): 1200–1218. https://doi.org/10.1080/24694452.2020.1775544 .

STAY CONNECTED WITH US
Be the first to hear about our latest Advocacy Alerts and events, and get updates on the work our organization is doing every day with the support of people like you.
Local Motion does not discriminate on the basis of race, color, religion, sex, gender, age, national origin, ancestry, sexual orientation, or disability.
For civil rights inquiries, contact the Local Motion CEO.